Tuesday 22 December 2015

Favourite maps from 2015

I feel it's been a good year in cartography. Since I started this blog, focusing on cartographic howlers, the various tools with which people make maps have improved and the quality of maps is also improving. Maybe there's some learning going on? Maybe people are striving for a better product? Maybe it's just harder to make mistakes? Whatever the mix of forces at work, I've woken more often to a decent diet of maps across social media than in previous years which can only be a good thing.

Of course there's still real humdingers and cartofails but there always will be. The balance seems to be shifting as defaults in mapping tools improve and, hopefully, people's acceptance of sub-par products is waning. I've always maintained that quality beats quantity and great maps will always outshine the rest. It's therefore pleasing to see so many year-end reviews focus on what are actually good maps rather than just a list of viral click-bait cartography. I've seen some great maps this year and the fact this blog was difficult to compile to keep it to a manageable length is testament to that fact.

We've seen a good number of new books on cartography this year too. Jonathan Crowe put together his usual review so head on over there to see the highlights. I'm bound to put in a little plug for MAP (Phaidon Press) because I had some involvement. Lovely Christmas book for that map-mad family member or friend. Others are available.

Some year-end reviews are already out there which are well worth a look (Visualoop interactive maps part 1, Visualoop interactive maps part 2Visualoop print infographics, Maps Mania). They generally focus on online/interactive maps although Visualoop's print infographics selections include many high-quality map-based products. Thanks to those who put some of my work in their lists :-)

Here, then, I'd like to offer my selection of my favourite maps of the year which go beyond just reviewing what you can access online. Some you'll have seen because they are shared widely on the internet. Some I saw at various conferences and use that odd technique called 'printing and publishing'. That means they are on a medium called 'paper' so they might not have got the 'likes' that web offerings can garner. My criteria are simple...the map made me want to spend time with it. It was pleasing to look at and functions well in the context of its purpose. Sometimes I wanted to use the map to find something out. Sometimes I just wanted to look at it and enjoy.

So in no particular order...

A world of lotus, a world of harmony by Liao Zhi Yuan
A lovely little hand-drawn map by 15 year old Liao Zhi Yuan from China who won an award at the ICA Children's Map competition in Rio. Such a simple idea and beautifully drawn.


Flaming Gorge by Patrick Kennelly
Wonderfully atmospheric terrain rendering with sumptuous use of colour to pick out the water. Rather than just pick out terrain, the technique includes complex shadowing to create a stunning depth of tonal variation.


Route guide for the Cumbres & Toltec Scenic Railroad by Doug Cain
Situating the figural railroad against a beautiful backdrop, this is an old style strip map presented in three overlapping sections. Not every map has to fall in a single rectangle!


Graphical and Statistical Atlas of Switzerland 1914–2014 by Federal Statistical Office
A perfect example of how to make a thematic map atlas. great use of colour, typography and layout. If web cartographers want something to aim for in terms of visuals...just study this atlas.


Antarctica and the Southern Ocean Seafloor by M. Buchroithner and L. Radig
Difficult to show in a photograph but this map takes lenticular printing to a whole new level. The map, quite literally, has depth and makes excellent use of the medium showing different features as different layers.


The Magnificent Bears by Annukka Mäkijärvi
Attractive and engaging. At first glance just a choropleth map but a great example of building artistry into the map in a subtle way. Possibly my favourite map of the year.


The New York Skyline by National Geographic
Excellent interaction, flow and layout of this web story with terrific use of 2D and 3D isometric views. A lot has been omitted - that's the success of this. Less is more. Online here.


Non-stop by Alberto Lucas López
A great use of projections and effective colour to reveal something specific marries form and function perfectly. A great antidote to flashy interactive stuff which just isn't needed much of the time. A huge dose of cartographic control and polish.


Global View: Climate Change in Perspective by Bloomberg
Simple but nicely rendered spinny globe. Good combination of text, images, maps and graphs. Judicious use of colour. Online here.


London Squared by Aftertheflood
Just a simple cartogram but it works well and has multiple uses with versions that hold images and different graph types. Recognisably London with great use of the River Thames in the design which anchors it much like the tube map.  Online here.


PAC-MAN by Google Maps
Google are going to find it tough to beat their 2015 April 1st offering next year. Combining the classic arcade game across the map - so much fun (and hours).


Goodwood Festival of Speed visitor maps by Mike Hall
Mike's unique style gives this map a unique character. Large scale plan views and lovely isometric drawings accompany it. Worth exploring his other cartographic work including illustrated plans of London. Online here.


Airbnb activities by Airbnb
Not all virtual globes are the same. Here, a stylized effort with cartoon planes and landmarks makes this a stand-out from the rest. Nice detail and animated symbology throughout. Online here.


36 (virtual) views of Mt Fuji by Nathan Shephard
Co-worker Nathan Shephard has built a wonderful innovative map locating and showcasing Hokusai's famous paintings. Nice use of 3D cartography with billboarded art. Here's his short video showcasing the work. Online here.


UK 2015 general election results in full by The Guardian
Comprehensive dissection of the election results using a hexagonal cartogram base and different ways to interactively slice and dice the data. Detailed and invites exploration. Online here.


Killing the Colorado by Propublica
Top drawer online story telling with excellent use of embedded maps and one of the few maps where an imagery base combined with simple vector overlays makes sense.. Online here.


Do you remember where Germany was divided? by Berliner Morgenpost 
A very clever way to engage and actively involve the readership by getting them to draw the historic divide on the map. Such a simple idea but so captivating. Online here.


A Journey Through Time by Swisstopo
A slick interactive portal to explore the delights of Swiss cartography since 1884. Includes a beautiful 2.5D tilt too. Online here.


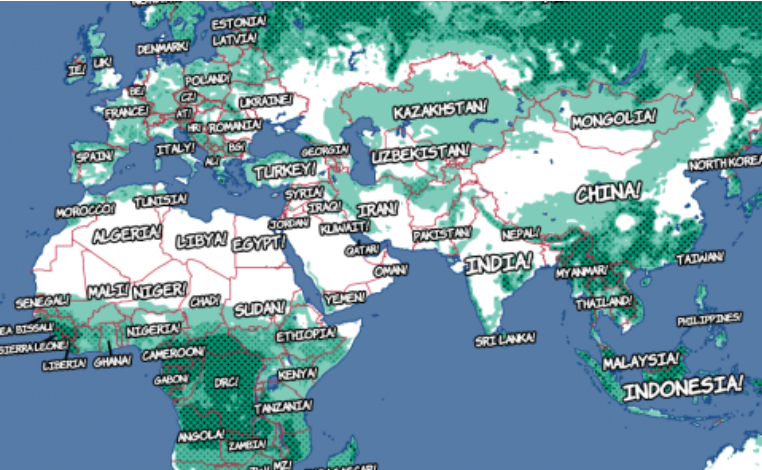
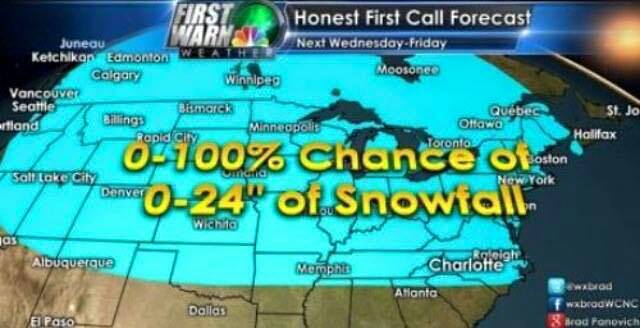
And the worst map of the year? Ryan Maue's continued efforts with the abominable rainbow colour schemes on his weather forecast maps.


He won the Gromit award for the worst map at the Mapping Together conference earlier in the year and I can't quibble. Worthy winner though there's also been some other humdinging cartofails such as...

Embedded image permalink

Embedded image permalink


Embedded image permalink


And that's it for 2015. There's always a danger that between now and the end of December someone will publish something worthy of inclusion. Maybe. We'll see. Mappy Christmas.

Monday 12 October 2015

Principles of cartographic design

I was following an email discussion late last week regarding the search for some online principles of cartographic design. Many exist in various books that those with a cartographic background are aware of but, of course, people prefer to want their information for free via their glass lens on the world. Actually, there aren't many online. Ordnance Survey have some here which are certainly worth a look but it's still books that get into the detail you'll need if you're going to really learn about cartography.

Some see principles as rules but that gives them a status of authority and absoluteness that suggests they shouldn't be broken at all, at any cost. There are some rules in cartography (such as which govern effective text placement; or to process data into a rate for a choropleth map) but I see principles as guidelines that provide oversight for the map you're making. I'm happy for them to be challenged and broken and innovation often comes from that process. I'm also strong of the opinion that if you know some principles you're in a good position to also know when and how to challenge them in your design. You'll also be able to easily recognize when a map eschews principles and simply fails.

One of my friends from the UK, Alan Collinson (of Geo-Innovations) reminded everyone in the discussion of the principles that the British Cartographic Society Design Group drew up some time ago. I'm guessing this would be the late nineties or thereabouts. I have a vague memory of them at the time but the internet wasn't then what it is now and these ideas tend to get lost. Many good cartographic minds and practitioners conceived of them so I thought it worth posting them here, as is. Some may find them helpful. Interestingly, the principles are prefaced with three statements and as you read through you can see the underlying current of fear about the spectre of GIS as a threat to cartographic design. Perhaps the parallel now is the threat to quality by ubiquitous citizen mapping?

STATEMENTS ON CARTOGRAPHIC DESIGN

The purpose of cartographic design is to focus the attention of the user.
The Principles of cartographic design are timeless, the results are not.
The rules of cartographic design can be taught and can be learnt, principles and concepts have to be acquired and practiced.

THE 5 PRINCIPLES OF MAP DESIGN

1.  CONCEPT BEFORE COMPILATION
Without a grasp of concept the whole of the design process is negated.  The parts embarrass the whole. Once concept is understood, no design or content feature will be included which does not fit it. Design the whole before the part. Design comes in two stages, concept and parameters, and detail in execution. Design once, devise, design again User first, user last.  What does the user want from this map? What can the user get from this map? Is that what they want? If a map were a building it shouldn’t fall over.

2.  HIERARCHY WITH HARMONY
Important things must look important, and the most important thing should look the most important."They also serve who only stand and wait". Lesser things have their place and should serve to complement the important. From the whole to the part, and all the parts, contributing to the whole. Associated items must have associated treatment. Harmony is to do with the whole map being happy with itself. Successful harmony leads to repose. Perfect harmony of elements leads to a neutral bloom. Harmony is subliminal.

3.  SIMPLICITY FROM SACRIFICE
Great design tends towards simplicity (Bertin). Its not what you put in that makes a great map but what you take out. The map design stage is complete when you can take nothing else out. Running the film of an explosion backwards, all possibilities rush to one point. They become the right point.  This is the map designer's skill. Content may determine scale or scale may determine content, and each determines the level of generalisation (sacrifice).

4.  CLUTTER TO CLARITY
Maximum information at minimum cost (after Ziff). How much information can be gained from the map, at a glance? GIS has forced cartography into one of its utility phases, the necessary information but without visual interpretation. What we need is functionality, not utility.  Design makes utility functional.  Design increases the information transfer process because a
well designed map has clarity.  Clarity is achieved by compromise. All designs are a compromise.  A compromise between what could be shown and what can be read and understood.

5.  EMOTION EXPRESSES, ENGAGES AND ELUCIDATES
Engage the emotion to engage the understanding. Here is the crux for all GIS Systems.  The one thing that cartographers acknowledge when creating maps is that it takes something out of them. They have expended some invisible emotional energy in the act of creation. When a GIS system cries over its map then I believe we cartographers will be defunct. Design with emotion to engage the emotion.  Only by feeling what the user feels can we see what the user sees. Good designers use Cartographic fictions, Cartographic impressions, cartographic illusions to make a map.  All of these have emotive contents. The image is the message. Good design is a result of the tension between the environment (the facts) and the designer. Only when the reader engages the emotion, the desire, will they be receptive to the maps message. Design uses aesthetics but the principles of aesthetics are not those of design.  We are not just prettying maps up.

There you go...maybe we should think of updating them? Actually, I am...in a book I'm currently writing with Damien Saunder called 'Cartography.' A book. Not a web site. We're excited by it...a modern book on cartographic design that delivers principles and practical advice. As of today we're about half way through writing it and hoping it'll be published by the middle of next year.

Tuesday 6 October 2015

Voronoi footballs

Via Keir Clarke's Maps Mania I saw the latest voronoi designed map this morning. Made by Guus Hoekman, the map uses voronoi polygons to subdivide the world such that each polygon represents a spatial partition that contains one football club.


It's a neat coded solution for the novice football supporter to simply locate themselves and then determine which is their closest team. 

Why get all cartonerdy about it then? Well, partly because I've not had a good cartonerd rant for a few months (despite several maps causing much ire) but moreso, because maps like these never seem to go beyond providing a small technical solution to an overly simplistic question. The real world is far more complex than maps like this ever try to take on. Closest is not necessarily the way you choose your team.

Football (probably most sport fandom) is a hugely complex soup. There are three rules for supporting an English football team. First, you support the team you were born and raised closest to so in that respect the map could be deemed a reasonable effort. Proximity gives ample opportunity for the young supporter to shift allegiance if parents move around a bit as well, before your fandom settles. The point here is that you don't need a map to tell you you're local birth-right football team but being close doesn't always stack up either. County or city boundaries, rivers and other features can all modify proximity.

Second, you support the team your father supported. Before someone screams 'what about your mother's team? Well, to be honest your father should have already got that covered if he chose his partner wisely. This is always a good option if your parents moved to somewhere bereft of a decent team yet hailed from a footballing mecca. If neither of these solutions appeal, you simply support Manchester United because that's what you do if you've never been anywhere near Manchester.

Regardless of these basic rules, supporting a team is so much more than a geometric solution that a map can provide. It's about territory, local rivalry, physical and social geographies and all sorts of other real world dimensions that cannot be adequately represented by voronoi polygons.

The map has omissions. It fails to show the lower leagues of most countries. It only considers the men's game and for some countries, such as the U.S. the women's game is arguably more popular anyway.

The map allows the classic 'neutral' fan to select a team based on tier. Why would anyone bother with lower leagues? Let's take a look at how this plays out by selecting just the first tier teams in an area I am familiar with.


So in England, being from Nottingham, the map would encourage me to support Leicester City. An odd choice since local rivalry dictates this is impossible. Worse, the map suggests that I would likely be sat alongside someone from Derby. This is utterly absurd. And look more closely...the English Premier League teams are on the same map as the Welsh Football League. They just don't compare.

My team is Nottingham Forest. I was born in Nottingham and raised 2 miles from the ground, on the right side of the River Trent to be a Forest fan. If my parents had decided to live on the other side of the river I'd have been a Notts County fan (shudder!)...or else I might have invoked the second principal and supported Chelsea since my father's lineage gave me that option. My mother's background was irrelevant...Rotherham United - footballing wilderness. I was fortunate when growing up that Forest happened to be one of THE most successful teams of the era (late 70s and early 80s in particular). What a fantastic quirk of location...I'd nailed it by luck alone.

Tragically, they've not been so good recently (by recent, I mean 20+ years and at least once I vaguely considered invoking the Chelsea lineage) and are now in tier two. According to the map below I am at least I'm properly deliniated from that lot from Derby and Leicester with perfect walls erected...though not quite in the right spot based on the geography of the places themselves.


Furthermore, most of Lincolnshire remains in Forest territory and this is wrong (unless you're my brother who sadly moved in this direction but at least maintains his footballing heritage). Adding tier 3 attributes the vast expanse of flat nothingness that is Lincolnshire to Peterborough United while Forest's polygon shrinks to make way.


But that doesn't stack up either. Peterborough's average attendance is 5,600 whereas Forest's is about 20,000 so the polygon doesn't really relate to the potential pool of support. Or does it...Nottingham is a much larger city in terms of population size (310,000) that Peterborough (116,000) though much of that expanse around the town is rural and sparsely populated. So, again, voronoi representations really don't adequately represent population distribution, structure or density of the real places from which support for a team is formed.

Finally when we add all teams into the mix and look at England's best supported team again...they are represented by one of the tiniest polygons. Most of Manchester United's fans live outside of this polygon and it's likely many of Manchester City's fans live inside it.


So voronoi's look nice, they are easy to make and when you have a point-based dataset you can compute them to demarcate space. Whether they make any sense whatsoever is down to understanding the input data and the questions you want the resulting map to support. In this case, the geography of football fandom is so much more complex than a voronoi can ever hope to show.

Want a more considered view of football fandom and how it is spatially formed? Check out James Cheshire and Oliver Uberti's Football Tribes map in their superb book The Information Capital. Football Tribes:


It's based on tweets (a dataset I've often been critical of) but heck...at least it demonstrates the complex structure of football fandom and how it is in no way possible to use a voronoi polygon as a way of reflecting on that geography.

Ultimately, data isn't just data. It has context. It often requires a deeper understanding and domain knowledge before you begin to represent or map it. Often, it's incapable of being used on its own to support meaning.

Wednesday 17 June 2015

True Size of Africa - now in three dee!

A few years back, designer Kai Krause made his multi-viral 'True Size of Africa' graphic. It's what got me riled enough to start this blog and it was the focus of my first post as I re-drew the map using shapes from an appropriate equal area projection. I got called a 'marauding cartonerd' for making some salient observations and making the corrections.

He got a bit miffed that people were pointing out errors in his work but he remained committed to the cause of simply trying to show that Africa is a big place. His wholly misleading map constantly bubbles up on the internet. The critiques get largely ignored because few care about accuracy and the world keeps turning. Except he's only gone and updated the graphic.

Scientific American published his new graphic in a blog entitled Africa Dwarfs China, Europe and the U.S. in a section called Graphic Science.

Nervously, I went over and took a look...and this is what I saw:


Now let's be clear, the aim of educating people that the Mercator projection distorts our perception of reality and that Africa as a continent has suffered more than most is commendable. Fighting immappancy (as Krause described this lack of understanding of geography) is also close to my heart. But using maps incorrectly is where I get all cartonerdy.

You'd think, perhaps, that Krause might have taken some of the criticism on the chin and used this update as a way to correct his own immappancy. You'd also think that in a publication that profers the importance of 'science' that accuracy might be important. You also may presume that anything in the 'Graphic Science' section would be scientifically accurate in its visual display. Let's see eh?

Like many, Krause has embraced 3D. People love 3D. It looks cool and literally gives maps depth. So this new graphic is attention grabbing because of it's three dee-iness alone.

However - 3D blocks in perspective wrapped round a globe creates visual distortions. In just the same way that on a flat map that uses Mercator the north and south are distorted relative to the equator, on a virtual globe we see distortions in the relative size and shape of features as they move away from the viewing point - the point closest to us as map readers. China therefore appears predominant and his rendering of Western Europe starts to diminish as it begins to wrap around the curve of the globe. So, visually, comparing like for like from a single point of view on a 3D perspective drawing (or globe) isn't a good way of showing comparisons...particularly when it's based on the relative size of areas (I wrote of these issues in a separate blog).

Notwithstanding the visual problems with interpreting the relative size of shapes across a curved surface, if Krause has at least got all his shapes in proportion during the construction of the graphic then we might at least be able to assume some semblance of relative size. BUT...the sizes and shapes didn't quite look right to me so I popped open my GIS package of choice and played with some shapes.

Given I re-drew the original 2D version I thought it only natural to re-draw the 3D version so here's my attempt at re-making his map with the same countries on a virtual globe:


I had difficulties re-making his map like-for-like for the simple reason that the real world shapes are not the same as he presents. Here's where Krause's map seems to fail:

  • China is not the same shape and has been warped to fit neatly over Madagascar.
  • The contiguous United States is much larger than he presents.
  • Krause included Germany and a partial set of Eastern European countries. There simply isn't room.
  • The real India is larger than Krause represents.

Of course I'm being cartographically pedantic again but if the very thing you purport to show is misrepresenting reality I don't think artistic license is a sufficiently good excuse. Yes, you could argue it's only a little bit wrong but if you're going to do something, why not do it right? Few who look at the new graphic will even think to question its authority and they will glean a distorted picture. That's the real issue.

The world will likely jump on his graphic and proclaim it as a great way to visualize differences in the size of areas. Like his 2D attempt, it's inaccurate. Will anyone care? I do. Should I have made a 3D version? Probably not. The 2D version is far more useful at supporting visual comparison of areas. Adding perspective and extruding the shapes to volumetric blocks just adds unnecessary visual noise that creates problems for our human processing of the map's message.

ht to @cartocalypse for the link

Sunday 7 June 2015

Bend it like Mercator

After their win in the Champions League final yesterday, the 101 Great Goals blog published a piece on the relative location of FC Barcelona's triumvirate of South American strikers. They picked up a map from Reddit that showed their birthplaces as being positioned in such a way that you can draw a perfectly straight line between them on Google Maps.

Here's the map:


A headline writer's dream...arguably the three best strikers in the world all born in formation as well as playing in formation for the world's best team. An easy map to make...take a pen and draw a line across the map to link three red symbols, each of which is about 50 miles in diameter in real world units. Job done.

Except the map is incorrect...which makes the headline potentially incorrect too. A straight line between two places on the globe becomes a curved line when projected using Web Mercator (which the Google Map used by the author is in this case). You cannot simply draw a straight line on the map and infer that it represents a straight line on the curved surface of the globe - because it doesn't.

Here's what the line looks like on a virtual globe as if looking from Messi's birthplace to Neymar's birthplace:


And when we place that line back onto a projected flat map, here's the outcome:


The line now has a slight curve to it but with symbols about 10 miles in diameter it still just nicks the edge of the town where Suarez was born. If I'd used smaller symbols I could have shown the line doesn't pass through Salto, Uruguay. If I'd used big red blobs like the original then of course the line would pass through Salto. Built correctly, we not only get an accurate map...but one that supports the story even better!

OK, we're talking small margins here but the author of the original map got very lucky simply because of the quirk of geography relating to the three players he chose to link on the map. Because the three locations are relatively close to one another (in global terms) and they are also only 30 degrees or so south of the equator we don't see a massive distortion in the line. It has a curve, yes...but only a slight one.

But what if we look at three other footballers? Wayne Rooney was born in Croxteth, Liverpool. Harry Kewell in a Sydney suburb in Australia; and C. V. Pappachan, the famous (?) former Indian footballer born in Thrissur. Here's their map:


As far as I know there is nothing at all to link these three footballers but if we'd taken the mapping approach used to link Barcelona's strikers we'd also get a perfect straight line passing from Liverpool in the UK, all the way to Sydney, Australia via Thrissur on the southern tip of India.

If you got in a plane and flew the straight line route between the UK and Sydney the closest you get to Thrissur is about 2,500 miles. The red line shows the planar version of a straight line projected on Web Mercator. I included the Barcelona striker's line for scale which shows that smaller distances, particularly near the equator, 'appear' less curvier.

News aggregators, blogs and, well, pretty much anyone should question maps. They lie. They are terrible at telling porkies. Worse. Most map readers don't know they're being fed a lie because they look authoritative; and they don't know that the maker of the map they're looking at didn't know the pitfalls of their approach either.

As it turns out, Barça's strikers do happen to have been born close enough to almost lie in a straight line on the globe and on the map. The curve on the projected map tells the accurate story. Try telling the story using three other footballers who appear to have been born along a straight line on a map and chances are, they weren't.

Hat Tip to Brian Timoney for the tweet about this map.

Saturday 6 June 2015

Colour me bad

Cartographers have often been accused of doing little more than drawing lines and colouring in. It's a rather negative and stereotyped perception that fails to acknowledge the many different aspects of the job of making a map or indeed, to what purpose the map design is intended to support.

I've therefore become concerned at the growing trend of maps that appear to be created simply to showcase, how do I put it, drawing lines and colouring in. Most of us probably had paint-by-numbers kits as kids but we grew up and started with a blank canvas which was far more challenging but ultimately, more rewarding. Cartography has regressed to paint-by-numbers. People no longer start with an empty canvas. Having the data and colouring in tools is so useful in so many ways but for far too many it's just an excuse to do some mapping by numbers. We're not being stretched to think about the map any more. We're simply putting together component pieces from others and painting them in different ways.

Take the following examples which have garnered much love on the interwebs. I'm deliberately not naming the authors and I have no particular issue with the end products because on the whole, aesthetically, they work as pieces of art. But do they work as maps? I think they're illustrative of a paint-by-numbers craze in modern cartography.


One of the major requirements for a map has always been base data to give context, situate our own data or simply to indicate the pattern that humans make on the natural landscape. Over the past few years acquiring base topographic data has become ridiculously easy through the many open and paid-for suppliers that exist. Many of these come pre-styled into designs that support a variety of uses. Many of them can be re-styled using a number of different approaches. The processes of data collection, processing and generalisation are largely ignored by today's modern map-maker. Instead, they simply regurgitate other people's data and re-style to distinguish their map from everyone else's maps. The maps above then leave it at that. They go no further and they offer no clue as to what their eventual purpose might be other than as an example of painting data.

The result of all of this artistic expression is simply that we're seeing an awful lot of re-styled versions of the same data. They are painted maps in their own right but what function do they support beyond that? They appear to exclaim that form is the end-goal and function is all but forgotten. Pretty yes, but none of the maps you see above can really be used for anything purposeful. The balance between figure and ground is so often forgotten in many of these re-styled maps as well..and the typography is often poorly integrated. Putting our own data on top of them would be pure folly.

The maps are fun it’s true. But is the exercise of colouring in data doing anything to enrich cartography? In its simplest form we're using freely available vector data, popular and widely available design and production environments and then, well, changing the colours of the vectors. What does this prove? It proves we're able to find the RGB values of some inspirational art or colour schemes from nature and then change the map data accordingly. This is nothing more than buttonology – a longstanding issue, debate and criticism of digital cartography and geo-technology in general. We're losing our ability to understand the structure of the data in a cartographic sense or to wrestle with it in conjunction with typographic elements, layout or thematic overlays. We're losing our understanding of cartography.

Of course, we've been conditioned to accept that a pre-styled base map is adequate for making maps. How many maps do you see where someone puts a choropleth on top of a topographic basemap for instance? Using topographic, or reference, base maps just makes no sense for thematic cartography but it's an easy solution because it requires no effort. Actually, getting the balance between base and theme, ground and figure does require effort and should be part of our concern as cartographers. Effort is required. Effort should be rewarded but I see far too many of these painted maps get accolades they scarcely deserve.

Painted maps tend to show little cartographic quality. The re-painting of the data only illustrates the map-maker's ability to use a piece of software. There's no real generalisation of the data; selection of data or omission of clutter. There's hardly any graphical hierarchy built in to the map or emphasis on how colours interplay between symbols or across the map. Random features get symbolised in bizarre ways simply because the data exists so it should be coloured. How could the lines be simplified or exaggerated to the extreme but still give us a sense of the map? How might clarity or legibility be changed and to what extent? Is it possible to invert the data in a visual sense or play with the layout in ways the riff off approaches in art more generally? And what happens when you zoom in or out of the map...does the style update as the data is progressively generalized or modified at different scales? Rarely does any of this happen. We simple get more of it at larger scales but there's little nuance to the way the data is portrayed.

A lot of art deconstructs images and objects. Think of how Warhol approached bananas or a tin of Campbell’s soup or a picture of Marilyn Monroe. His art was to express the figure of his work in a new, different way. Re-colouring data on a map doesn't go far enough. It doesn't show any sense of design acumen. Maybe I'm just getting bored of all the so-called re-imaginations of map data but where is the originality? Where is the expression? Where is the cartography?

It's always nice to play around with maps and experiment (I do it all the time) but at some point we've got to go beyond being seduced by the technology and get back to understanding of the map and the relationship between aesthetics, form and function. Learning to change the appearance of symbols is good. Goofy and experimental mapping is also good. 'Goofy and thinky' is, to quote Hannah Fairfield (of the New York Times at OpenVis 2015), far better.

It’s the thinky bit that I feel is missing from this type of work and that the seduction of being able to use the data and do something to it relatively easily is what counts for many. Over the last ten years or so, the shift in time from having to collect and process all this data before you can even get to styling it has been profound. Someone’s done all the hard work. Actually, millions of people have done the hard work. Isn’t it incumbent on us to honour this work and take it further than simply painting it?


I think this sort of work might be generally called inconsequential cartography. I’d like to see more consequential cartography. I’m all for playing with the map in artistic ways but take it further. Make a statement. Make it say something. Make it work in concert with some other data to create a map, rather than just changing the basemap. Give it a real purpose. Give it a context. Marry the playful form with a function.

Sunday 17 May 2015

Helecxagon mapping

Two things happen whenever there's an election. First, politicians wander round spouting rhetoric in an attempt to persuade us that their colour is the one we should care about. Second, cartographers and map-makers everywhere develop a palpable sense of excitement as a new national dataset is quite literally born overnight. From a cartographic perspective, the recent UK General Election didn't disappoint.

Politically, the Conservative's couldn't have imagined such a result; a majority from seemingly out of nowhere and against all the polls. Labour were trounced and no more so than in Scotland where the Scottish National Party all but turned the map from red to yellow. The UK Independence Party did well in vote share (12.6%) but this translated into only one Parliamentary seat.

For those unfamiliar with how a UK election works, Great Britain and Northern Ireland are subdivided into constituencies. The population of each constituency get to vote for the person (standing on behalf of a political party) they would wish to elect as their Member of Parliament (MP). The votes roll in, are counted, and the person with the most votes wins that constituency 'seat' in Parliament on behalf of their party. There are 650 seats overall and the party that gains a majority of seats gets to form the government as overall winners. So, the party that reaches 326 seats wins. There's a lot of complexities if no single party gets 326 seats but let's not get into that...this isn't a political blog.

So the result was fascinating in and of itself but let's get stuck into the cartography...

Back in 2010 at the last UK General Election most news agencies went with a standard geographic map showing the results by colour of the winning party.


The trouble with this approach is that larger constituencies dominate the map in visual terms. Smaller, inner city constituencies can hardly be seen on a national map like this. It distorts the way we see the election results. On this map there's a lot of blue and a fair bit of yellow and gold. Not much red.

Alternatively, cartograms offer a form of thematic mapping that accommodates the difference in size of areas. There are plenty of alternatives. The Gastner-Newman population density equalizing cartogram tries to preserve some sense of geography while squeezing and stretching shapes. It appears a little odd to some people. The DeMers uses squares, the Dorling uses circles; both perfectly good shapes and then...there's the hexagon. Here's the 2010 results again, this time mapped with equally sized hexagons.


The colours are now equal in terms of the area they occupy on the map. The gold and yellow in the large Scottish constituencies have receded. The blue has also been shifted in visual importance as many far smaller constituencies that elected a Labour MP (red) are now visible. There was a hung parliament in 2010 and the Conservatives (blue) had to do a deal with the Liberal Democrats (gold) to get over the 326 seats needed to form a coalition government. The map in this form is a much more useful mechanism for communicating the results for this specific data. It tells the story far more effectively than a geographic map.

Hexagons have been used as a framework for mapping since at least 1895. They were also promoted by Danny Dorling in the 1980s as a method for mapping election results because they are close to circular (and thus pleasing on the eye) and they tesselate well, providing flexibility and six shared boundaries each. Dorling noted this was a pretty good fit for UK political geography. Oxford University recently published a blog reminding the world of Dorling's work prior to the recent election.

Sporadically, news agencies have used hexagons but this year the hexagonal cartogram went viral. Virtually everyone used them. In fact, you'd be hard pushed to find a news agency or media outlet that didn't. Andy Kirk even proposed a new name - the elecxagon map which struck me as a fun way to refer to them in this context. I modified it a little more - 'helecxagon'. So let's take a look...

The BBC got the 6 sided ball rolling with a giant physical map they built in the piazza at Television Centre. A map you could walk on. A map that had tiles added throughout the night as results came in. A map that was used for short interviews with virtual nobodies and which they panned across as they went to new bulletins. A map that was, well, rather under-used. Shame. It's almost like they didn't really know how best to use it as part of their broadcast.


BBC piazza election map

The BBC web site (and many of their other digital mapping) curiously did not go for hexagons which they had used successfully in 2010. An odd decision and with their under-used giant hex-map they dropped the ball a little in mapping terms.

Others filled their boots as the results rolled in and web maps began to be coloured in. The Telegraph used a hexagonal cartogram, as did Sky News

Sky news web map

The Telegraph election web map


The Independent went with a hexagonal cartogram too...but the web page opens with the geographic version and there was an option to switch to a geographic version if they wished.

The Independent web map


In their print media, The Independent preferred a geographical view and they also offered a slider comparative view comparing the 2010 with the 2015 results on their blog...again, geographic.

The Independent print version

The Independent 2010/2014 comparison slider

Bloomberg also gave visitors to their web site the option of a geographic or a hexagonal cartogram. What I particularly liked was the way that the map transitions between geographic and hex through animated proportional hex symbols. Largely meaningless, they did provide a subtle visual link between the abstract hexagons and the real geography. Using a transition gives the eye something to follow and it's arguable that it aids our interpretation of where places are in relation to one another.

The transition state of Bloomberg's web map

Bloomberg also had a fun animated map by Julian Burgess and Adam Pearce who used a blank canvas with no boundaries of any form, across which splodges of colour were fired. The results are animated so a map of colour builds during the 25 seconds that the animation plays. It's a piece of visual data art and one of the more interesting approaches to mapping the data. There's no way you can recover the results or explore the data but that's not the point. It's exists because they had a good idea. It works.


Ollie O'Brien produced a live map for election night that updated the results. He has since made a few post-election maps showing various metrics such as swing in share of vote, turnout etc. Plenty more discussion on his blog and a link to a web map featuring the various layers here. Ollie went for a geographical view of the results and multivariate proportional symbols.

Swing map by Ollie O'Brien

Ben Hennig couldn't settle on a particular style so went with the option of providing three versions on his maps of the results. He illustrates the geographic, hexagonal cartogram and a gridded population-equalizing cartogram side-by-side. You get three maps for the price of one with Ben's work and if nothing else it's a good way to show the different trade-offs between map type. More detail on Ben's blog and his continuing work with Danny Dorling in developing cartograms.

Three-in-one map by Ben Hennig

In my opinion The Guardian provided the most compelling and complete cartographic service on the night itself. A map that was coloured in as results came in, that auto-zoomed and panned to a constituency you could search for or click on. The live election headlines scrolled next to the map and they to were geographically enabled so clicking on the headline brought up the results for that place.

The hexagons showed regional boundaries and constituency boundaries, hover the mouse and you got some basic detail. Click and you get more.  More than that, you could switch between the overall map showing the winning party (using the traditional colours) to a map that showed majority, turnout, and vote share by party. While still using the basic cartogram, these maps used transparency (as an unclassed choropleth) and proportional symbols (arrows) well to convey the message of the different election metrics. Lots to interest both the casual reader and those more interested in digging a little deeper. Supporting graphs and tabulated results as well as subtle labels added to the overall approach and usability.

The Guardian general web map

The Guardian vote share for Conservatives web map

The Guardian turnout web map

The Guardian swing (here, to SNP) web map

And so, after the serious maps come the frivolous. There were plenty but these are the ones that caught my eye.

It soon became clear that the Scottish National Party were sweeping Scotland with a swathe of yellow constituencies. With much of the rest of England and Wales being coloured blue or red, the comparisons with Maggie Simpson began proliferating our social media feeds.


Vaughan Roderick compared the final map with a quick sketch of traditional coal mining areas of the UK. These traditional industrial heartlands are staunch Labour areas and so the visual correlation between the red of the map with areas of strong support for the centre-left party are a natural fit. The approach gives context though and helps to lift the lid on why the map is coloured as it is. Of course, voting behaviour is far more complex but this was a useful way of reflecting on some of the historical and geographical reasons for the patterns.


Combining a cartogram with the beauty of a hand-made 'physical' map, Tom Katsumi opted for a cross-stitched version, adding a stitch as the results came in to colour in his cartogram based on squares.


Finally, my colleague Craig Williams even built his own map using giant building blocks...all four of them, some days before the election. Given the result, he was remarkably close.


And what of my efforts...they're coming along nicely. I have been making two interactive maps. One an artistic effort and one built from the ground up using 3D hexagons (I'm calling them hexstones). I wasn't intending to make the maps live on the night. Instead, preferring to work on the full results after the election and taking the time to make the map I want to make.

For the 3D map I went for hexagons because I've spent years making 2D cartograms...and I wanted to tackle the technical challenges of making tesselating hexagons on a 3D, spherical world. There's also a natural metaphor with the Giant's Causeway in Ireland and part of my inspiration was this picture of David Cameron taken last year.


My 3D map as a work in progress

The artistic one was partly inspired by the Bloomberg one but I want it to also reveal the data. I'm calling it a splat map.

My splat map as a work in progress

The election was fascinating. The cartography of the election was perhaps more fascinating if you're interested in maps (and if you've read this far I'm guessing you are).

It's pleasing to see the rest of the world waking up to the value of cartograms and, in particular, the hexagon though I wonder if there will be a backlash at the next General Election? Will everyone stick with the hexagon...or twist and search for something different that tries to set them apart. By the time of the next election there will undoubtedly be a raft of new technologies that may help or hinder as well.