Of course there's still real humdingers and cartofails but there always will be. The balance seems to be shifting as defaults in mapping tools improve and, hopefully, people's acceptance of sub-par products is waning. I've always maintained that quality beats quantity and great maps will always outshine the rest. It's therefore pleasing to see so many year-end reviews focus on what are actually good maps rather than just a list of viral click-bait cartography. I've seen some great maps this year and the fact this blog was difficult to compile to keep it to a manageable length is testament to that fact.
Flaming Gorge by Patrick Kennelly
Wonderfully atmospheric terrain rendering with sumptuous use of colour to pick out the water. Rather than just pick out terrain, the technique includes complex shadowing to create a stunning depth of tonal variation.

Route guide for the Cumbres & Toltec Scenic Railroad by Doug Cain
Situating the figural railroad against a beautiful backdrop, this is an old style strip map presented in three overlapping sections. Not every map has to fall in a single rectangle!

Graphical and Statistical Atlas of Switzerland 1914–2014 by Federal Statistical Office
A perfect example of how to make a thematic map atlas. great use of colour, typography and layout. If web cartographers want something to aim for in terms of visuals...just study this atlas.


Antarctica and the Southern Ocean Seafloor by M. Buchroithner and L. Radig
Difficult to show in a photograph but this map takes lenticular printing to a whole new level. The map, quite literally, has depth and makes excellent use of the medium showing different features as different layers.

The Magnificent Bears by Annukka Mäkijärvi
Attractive and engaging. At first glance just a choropleth map but a great example of building artistry into the map in a subtle way. Possibly my favourite map of the year.

The New York Skyline by National Geographic
Excellent interaction, flow and layout of this web story with terrific use of 2D and 3D isometric views. A lot has been omitted - that's the success of this. Less is more. Online here.

Global View: Climate Change in Perspective by Bloomberg
Goodwood Festival of Speed visitor maps by Mike Hall
Mike's unique style gives this map a unique character. Large scale plan views and lovely isometric drawings accompany it. Worth exploring his other cartographic work including illustrated plans of London. Online here.

Airbnb activities by Airbnb
Not all virtual globes are the same. Here, a stylized effort with cartoon planes and landmarks makes this a stand-out from the rest. Nice detail and animated symbology throughout. Online here.

Do you remember where Germany was divided? by Berliner Morgenpost
A very clever way to engage and actively involve the readership by getting them to draw the historic divide on the map. Such a simple idea but so captivating. Online here.

A Journey Through Time by Swisstopo
A slick interactive portal to explore the delights of Swiss cartography since 1884. Includes a beautiful 2.5D tilt too. Online here.

And the worst map of the year? Ryan Maue's continued efforts with the abominable rainbow colour schemes on his weather forecast maps.


And that's it for 2015. There's always a danger that between now and the end of December someone will publish something worthy of inclusion. Maybe. We'll see. Mappy Christmas.
We've seen a good number of new books on cartography this year too. Jonathan Crowe put together his usual review so head on over there to see the highlights. I'm bound to put in a little plug for MAP (Phaidon Press) because I had some involvement. Lovely Christmas book for that map-mad family member or friend. Others are available.
Some year-end reviews are already out there which are well worth a look (Visualoop interactive maps part 1, Visualoop interactive maps part 2, Visualoop print infographics, Maps Mania). They generally focus on online/interactive maps although Visualoop's print infographics selections include many high-quality map-based products. Thanks to those who put some of my work in their lists :-)
Here, then, I'd like to offer my selection of my favourite maps of the year which go beyond just reviewing what you can access online. Some you'll have seen because they are shared widely on the internet. Some I saw at various conferences and use that odd technique called 'printing and publishing'. That means they are on a medium called 'paper' so they might not have got the 'likes' that web offerings can garner. My criteria are simple...the map made me want to spend time with it. It was pleasing to look at and functions well in the context of its purpose. Sometimes I wanted to use the map to find something out. Sometimes I just wanted to look at it and enjoy.
Here, then, I'd like to offer my selection of my favourite maps of the year which go beyond just reviewing what you can access online. Some you'll have seen because they are shared widely on the internet. Some I saw at various conferences and use that odd technique called 'printing and publishing'. That means they are on a medium called 'paper' so they might not have got the 'likes' that web offerings can garner. My criteria are simple...the map made me want to spend time with it. It was pleasing to look at and functions well in the context of its purpose. Sometimes I wanted to use the map to find something out. Sometimes I just wanted to look at it and enjoy.
So in no particular order...
A world of lotus, a world of harmony by Liao Zhi Yuan
A lovely little hand-drawn map by 15 year old Liao Zhi Yuan from China who won an award at the ICA Children's Map competition in Rio. Such a simple idea and beautifully drawn.


Flaming Gorge by Patrick Kennelly
Wonderfully atmospheric terrain rendering with sumptuous use of colour to pick out the water. Rather than just pick out terrain, the technique includes complex shadowing to create a stunning depth of tonal variation.

Route guide for the Cumbres & Toltec Scenic Railroad by Doug Cain
Situating the figural railroad against a beautiful backdrop, this is an old style strip map presented in three overlapping sections. Not every map has to fall in a single rectangle!

Graphical and Statistical Atlas of Switzerland 1914–2014 by Federal Statistical Office
A perfect example of how to make a thematic map atlas. great use of colour, typography and layout. If web cartographers want something to aim for in terms of visuals...just study this atlas.


Antarctica and the Southern Ocean Seafloor by M. Buchroithner and L. Radig
Difficult to show in a photograph but this map takes lenticular printing to a whole new level. The map, quite literally, has depth and makes excellent use of the medium showing different features as different layers.

The Magnificent Bears by Annukka Mäkijärvi
Attractive and engaging. At first glance just a choropleth map but a great example of building artistry into the map in a subtle way. Possibly my favourite map of the year.

The New York Skyline by National Geographic
Excellent interaction, flow and layout of this web story with terrific use of 2D and 3D isometric views. A lot has been omitted - that's the success of this. Less is more. Online here.

Non-stop by Alberto Lucas López
A great use of projections and effective colour to reveal something specific marries form and function perfectly. A great antidote to flashy interactive stuff which just isn't needed much of the time. A huge dose of cartographic control and polish.

A great use of projections and effective colour to reveal something specific marries form and function perfectly. A great antidote to flashy interactive stuff which just isn't needed much of the time. A huge dose of cartographic control and polish.

Global View: Climate Change in Perspective by Bloomberg
Simple but nicely rendered spinny globe. Good combination of text, images, maps and graphs. Judicious use of colour. Online here.
London Squared by Aftertheflood
Just a simple cartogram but it works well and has multiple uses with versions that hold images and different graph types. Recognisably London with great use of the River Thames in the design which anchors it much like the tube map. Online here.

Just a simple cartogram but it works well and has multiple uses with versions that hold images and different graph types. Recognisably London with great use of the River Thames in the design which anchors it much like the tube map. Online here.

PAC-MAN by Google Maps
Google are going to find it tough to beat their 2015 April 1st offering next year. Combining the classic arcade game across the map - so much fun (and hours).

Google are going to find it tough to beat their 2015 April 1st offering next year. Combining the classic arcade game across the map - so much fun (and hours).

Goodwood Festival of Speed visitor maps by Mike Hall
Mike's unique style gives this map a unique character. Large scale plan views and lovely isometric drawings accompany it. Worth exploring his other cartographic work including illustrated plans of London. Online here.

Airbnb activities by Airbnb
Not all virtual globes are the same. Here, a stylized effort with cartoon planes and landmarks makes this a stand-out from the rest. Nice detail and animated symbology throughout. Online here.

36 (virtual) views of Mt Fuji by Nathan Shephard
Co-worker Nathan Shephard has built a wonderful innovative map locating and showcasing Hokusai's famous paintings. Nice use of 3D cartography with billboarded art. Here's his short video showcasing the work. Online here.

UK 2015 general election results in full by The Guardian
Comprehensive dissection of the election results using a hexagonal cartogram base and different ways to interactively slice and dice the data. Detailed and invites exploration. Online here.
Co-worker Nathan Shephard has built a wonderful innovative map locating and showcasing Hokusai's famous paintings. Nice use of 3D cartography with billboarded art. Here's his short video showcasing the work. Online here.

UK 2015 general election results in full by The Guardian
Comprehensive dissection of the election results using a hexagonal cartogram base and different ways to interactively slice and dice the data. Detailed and invites exploration. Online here.
Killing the Colorado by Propublica
Top drawer online story telling with excellent use of embedded maps and one of the few maps where an imagery base combined with simple vector overlays makes sense.. Online here.

Top drawer online story telling with excellent use of embedded maps and one of the few maps where an imagery base combined with simple vector overlays makes sense.. Online here.

Do you remember where Germany was divided? by Berliner Morgenpost
A very clever way to engage and actively involve the readership by getting them to draw the historic divide on the map. Such a simple idea but so captivating. Online here.

A Journey Through Time by Swisstopo
A slick interactive portal to explore the delights of Swiss cartography since 1884. Includes a beautiful 2.5D tilt too. Online here.

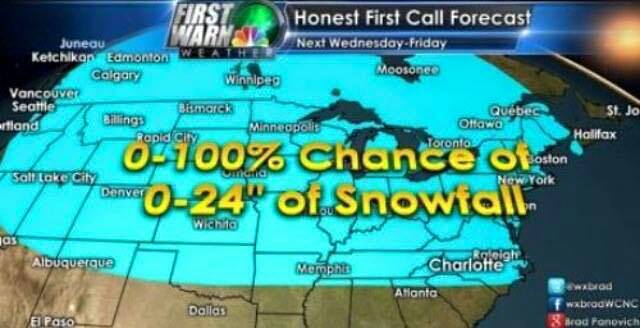
And the worst map of the year? Ryan Maue's continued efforts with the abominable rainbow colour schemes on his weather forecast maps.
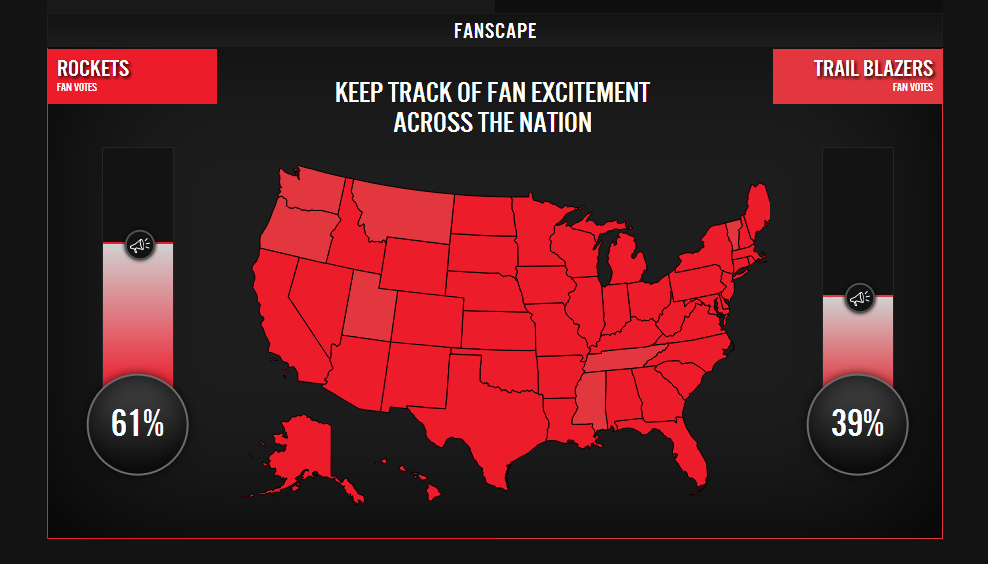
He won the Gromit award for the worst map at the Mapping Together conference earlier in the year and I can't quibble. Worthy winner though there's also been some other humdinging cartofails such as...


And that's it for 2015. There's always a danger that between now and the end of December someone will publish something worthy of inclusion. Maybe. We'll see. Mappy Christmas.


